Steven Ralston, CFA
|
|
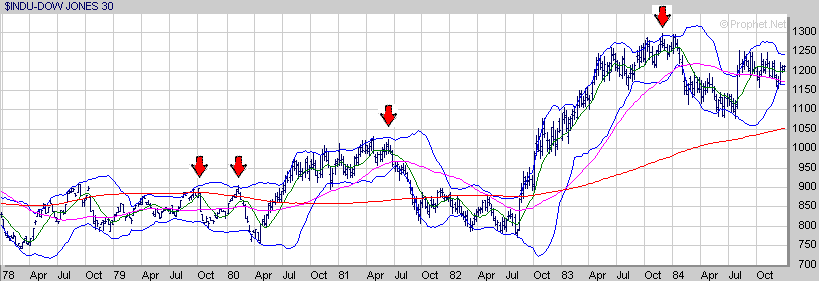
October 4, 1979
February 13, 1980 June 15, 1981 November 29, 1983
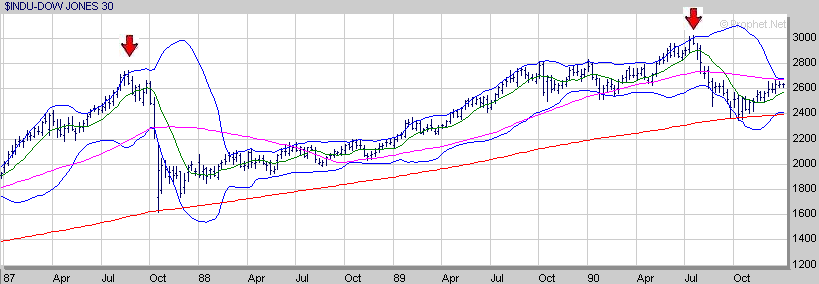
In 1985, after rigorously studying the market tops listed above,
tops in 1987, 1990, 1998, and 2007 on the specific dates listed below. August 24, 1987 July 16, 1990 July 17, 1998 July 19, 2007
to detect sharp declines (approximately 6 weeks in duration) of a magnitude of 20% or more within the context of a bull market.
An interesting conclusion from the lack of a signal between 2000 and 2002
| |||